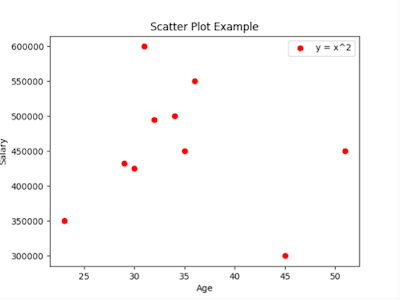
Scatter plot display individual data points as separate dots on a 2-dimensional system. Each do in the scatter plot represent a single data point.
Scatter plots are mainly used in Machine learning, statistics to identify the patterns, clusters, correlations etc.,
hello_world.py
import matplotlib.pyplot as plt
import numpy as np

age = [34, 35, 31, 36, 45, 23, 51, 29, 32, 30]
salary = [500000, 450000, 600000, 550000, 300000, 350000, 450000, 432500, 495000, 425000]

plt.scatter(age, salary, label="y = x^2", color='r')

plt.xlabel('Age')
plt.ylabel('Salary')
plt.title('Scatter Plot Example')

plt.legend()
plt.show()
Output

No comments:
Post a Comment