Below
command is used to get the thread dump of a java process.
thread.dump
Syntax
jstack
{PROCESS_ID}
Exmaple
HelloWorld.java
public class HelloWorld {
 public static void main(String args[]) throws Exception {
  Thread t1 = new Thread() {
   public void run() {
    while (true) {
     try {
      Thread.sleep(1000);
     } catch (Exception e) {

     }
    }
   }
  };

  t1.start();
 }
}
Compile
and run HelloWorld.java.
Open
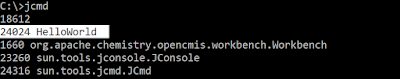
command prompt (or) terminal and execute jcmd command.

As
you see above image, HelloWorld application is running with process 24024.
Execute
the command jstack 24024 > thread.dump.
Open
thread.dump file, you can able to see below kind of output.
2018-07-27 19:45:23
Full thread dump Java HotSpot(TM) 64-Bit Server VM (25.171-b11 mixed mode):

"DestroyJavaVM" #11 prio=5 os_prio=0 tid=0x0000000005063000 nid=0x41b0 waiting on condition [0x0000000000000000]
   java.lang.Thread.State: RUNNABLE

"Thread-0" #10 prio=5 os_prio=0 tid=0x0000000021621800 nid=0x1804 waiting on condition [0x0000000021c8f000]
   java.lang.Thread.State: TIMED_WAITING (sleeping)
 at java.lang.Thread.sleep(Native Method)
 at HelloWorld$1.run(HelloWorld.java:7)

"Service Thread" #9 daemon prio=9 os_prio=0 tid=0x000000001e85d800 nid=0x5384 runnable [0x0000000000000000]
   java.lang.Thread.State: RUNNABLE

"C1 CompilerThread2" #8 daemon prio=9 os_prio=2 tid=0x000000001e809000 nid=0x5ec0 waiting on condition [0x0000000000000000]
   java.lang.Thread.State: RUNNABLE

"C2 CompilerThread1" #7 daemon prio=9 os_prio=2 tid=0x000000001e804000 nid=0x4084 waiting on condition [0x0000000000000000]
   java.lang.Thread.State: RUNNABLE

"C2 CompilerThread0" #6 daemon prio=9 os_prio=2 tid=0x000000001e801000 nid=0x5f98 waiting on condition [0x0000000000000000]
   java.lang.Thread.State: RUNNABLE

"Attach Listener" #5 daemon prio=5 os_prio=2 tid=0x000000001e7fd000 nid=0x52e8 waiting on condition [0x0000000000000000]
   java.lang.Thread.State: RUNNABLE

"Signal Dispatcher" #4 daemon prio=9 os_prio=2 tid=0x000000001e7fc000 nid=0x4764 runnable [0x0000000000000000]
   java.lang.Thread.State: RUNNABLE

"Finalizer" #3 daemon prio=8 os_prio=1 tid=0x000000001e7ea800 nid=0x3df4 in Object.wait() [0x000000001fb5e000]
   java.lang.Thread.State: WAITING (on object monitor)
 at java.lang.Object.wait(Native Method)
 - waiting on <0x000000076b508ed0> (a java.lang.ref.ReferenceQueue$Lock)
 at java.lang.ref.ReferenceQueue.remove(ReferenceQueue.java:143)
 - locked <0x000000076b508ed0> (a java.lang.ref.ReferenceQueue$Lock)
 at java.lang.ref.ReferenceQueue.remove(ReferenceQueue.java:164)
 at java.lang.ref.Finalizer$FinalizerThread.run(Finalizer.java:212)

"Reference Handler" #2 daemon prio=10 os_prio=2 tid=0x0000000005152000 nid=0x5f2c in Object.wait() [0x000000001fa5f000]
   java.lang.Thread.State: WAITING (on object monitor)
 at java.lang.Object.wait(Native Method)
 - waiting on <0x000000076b506bf8> (a java.lang.ref.Reference$Lock)
 at java.lang.Object.wait(Object.java:502)
 at java.lang.ref.Reference.tryHandlePending(Reference.java:191)
 - locked <0x000000076b506bf8> (a java.lang.ref.Reference$Lock)
 at java.lang.ref.Reference$ReferenceHandler.run(Reference.java:153)

"VM Thread" os_prio=2 tid=0x000000001e7c7000 nid=0x466c runnable

"GC task thread#0 (ParallelGC)" os_prio=0 tid=0x0000000005078800 nid=0x1ab8 runnable

"GC task thread#1 (ParallelGC)" os_prio=0 tid=0x000000000507a000 nid=0x5ee4 runnable

"GC task thread#2 (ParallelGC)" os_prio=0 tid=0x000000000507b800 nid=0x5f30 runnable

"GC task thread#3 (ParallelGC)" os_prio=0 tid=0x000000000507d000 nid=0x2554 runnable

"VM Periodic Task Thread" os_prio=2 tid=0x00000000215d2800 nid=0x5664 waiting on condition

JNI global references: 4
In
my next post, I am going to explain, ‘How to analyze thread dumps?’
No comments:
Post a Comment